Options
1000+ Gauntlet Rounds of Data
 Peachtree Rex
✭✭✭✭✭
Peachtree Rex
✭✭✭✭✭
in The Bridge
Reference Thread: https://forum.disruptorbeam.com/stt/discussion/6293/gauntlet-round-compilation#latest
Compiled Rounds: https://docs.google.com/spreadsheets/d/1sYlf7A6M-kaENSsxoHhiUrpNuv71zNRz50Izi-ARB6E/edit#gid=70142621
To start, I plan on continuing this project for the foreseeable future. The iampicard tool makes data collection very easy for a few of the rounds I run per day. If you would like to contribute your rounds, details on how are in the OP of my first post linked above.
I'd also like to express thanks to @TekmanRO for his wonderful tool that made this collection possible and Joker41NAM (couldn't get the @ to work?) for being the most consistent external source sending me rounds.
What this Data Isn't
People like to use the word "prove" in here a lot, and I'll be the first to say this collection doesn't (and could never) prove anything beyond a shadow of a doubt. I can compile evidence and it can point to things we should question, but until you can look at code and arrive at root causes, there's no way to actually prove anything.
What this Data Is
This is a collection of results from gauntlet rounds. My intent is to analyze the fairness of crit rates and roll distributions and to see of any of those discrepancies amount to biases in observed win/loss rates.
Organization
Sheets included:
Sheet Layout:
Analysis
Now for the most controversial thing I think I'll say here: based on current data collected, I don't think there is any thumbs on the scale in terms of gauntlet matchup operations.
All screenshots below are for the "General Analysis", but specific numbers of all the various analyses are available on the spreadsheet. Numbers may vary slightly if you look at this spreadsheet later as I am continuing to add more rounds as I go.
Crits
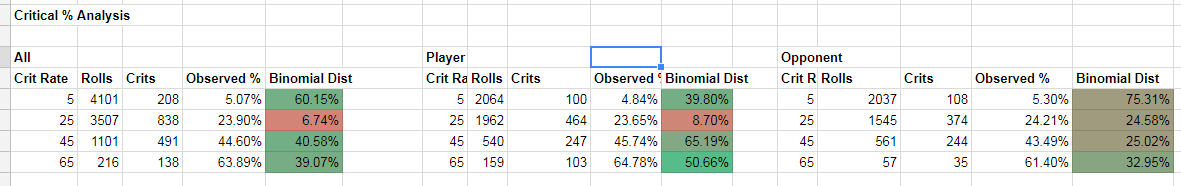
The most "suspect" number you'll see is in the 25% crit range. On the overall analysis, players are running in <10 percentile for 25% crits and opponents are running around 25%. To be clear, the OBSERVED crit rates are 23.65% for players at 24.21% for opponents. The percentiles expressed above are their binomial likelihood of being observed. This difference is also more pronounced if you isolate the analysis to "Reward Rounds", where players are at 22.29% observed crit rate (9.26% binomial performance) against 26.72% for opponents (80.16% binomial performance).
Roll Percentile

The percentile analysis looks a little "chunky", but the overall averages fall right where I'd expect. So far, I've attributed the chunky-ness to characters with narrower roll windows (which could have a disproportionate number of rolls allocated to different percentiles). I've eliminated rolls with min-max spreads of less than 100, but that didn't solve all of it. However, I am satisfied with the overall distribution.
Expected vs Observed Wins
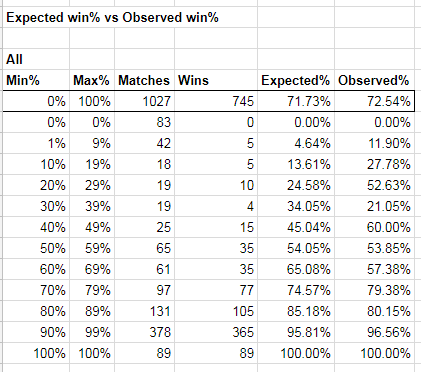
The expected win analysis is sort of where the rubber meets the road. The Expected Win% is entirely calculated by the iampicard tool. I will admit, I did not research the details on how this number is constructed. Suffice to say, it is independent of anything Disruptor Beam is doing on their side. If there are any biases elsewhere (like players having lower crit rates in certain situations) they would necessarily have to manifest as additional losses on the player side.
Across all rounds, the average expected win rate was 71.73% and the observed rate was 72.54%. In reward rounds, players tended to get a little more conservative and go for more likely wins. The expected rate was 78.83% and observed rate was 79.34%. Given how close all of these values are, I am unable to show any evidence of malfeasance.
Compiled Rounds: https://docs.google.com/spreadsheets/d/1sYlf7A6M-kaENSsxoHhiUrpNuv71zNRz50Izi-ARB6E/edit#gid=70142621
To start, I plan on continuing this project for the foreseeable future. The iampicard tool makes data collection very easy for a few of the rounds I run per day. If you would like to contribute your rounds, details on how are in the OP of my first post linked above.
I'd also like to express thanks to @TekmanRO for his wonderful tool that made this collection possible and Joker41NAM (couldn't get the @ to work?) for being the most consistent external source sending me rounds.
What this Data Isn't
People like to use the word "prove" in here a lot, and I'll be the first to say this collection doesn't (and could never) prove anything beyond a shadow of a doubt. I can compile evidence and it can point to things we should question, but until you can look at code and arrive at root causes, there's no way to actually prove anything.
What this Data Is
This is a collection of results from gauntlet rounds. My intent is to analyze the fairness of crit rates and roll distributions and to see of any of those discrepancies amount to biases in observed win/loss rates.
Organization
Sheets included:
- Compiled Rounds: Raw data of the analysis
- Analysis Settings: specific settings to setup the analysis. Currently, I only provide a minimum roll span to consider for "percentile" analysis.
- General Analysis: Statistics on ALL recorded rounds
- "Reward Round" Analysis: Statistics on JUST "Reward Rounds" (rounds where the user expects to get something other than merits/credits)
- "Other Round" Analysis: Statistics on rounds where the user will receive merits/credits
- Mirror Match Analysis: Data is isolated to just "mirror matches" of the same crew. With only 59 recorded rounds, this data is not very statistically significant.
- Round Dump: One user supplied me with 8000+ rounds at the outset of my data collection. They were unsure how they actually accumulated that many. Since I can't be confident in the validity of that data, I've excluded them from my analysis for the time being.
Sheet Layout:
- Crit Rates: Analysis of each critical roll for that round type. Number of potential rolls, number of observed crits, and a Binomial analysis of how likely the observed result is given the expected crit rate
- Percentile: The distribution of the "strength" of all rolls. The gauntlet appears to use a uniform distribution, so I would expect to see a similar number of rolls across all percentiles.
- Win Expectations: This uses the expected % displayed by the iampicard tool and charts it against observed wins/losses.
Analysis
Now for the most controversial thing I think I'll say here: based on current data collected, I don't think there is any thumbs on the scale in terms of gauntlet matchup operations.
All screenshots below are for the "General Analysis", but specific numbers of all the various analyses are available on the spreadsheet. Numbers may vary slightly if you look at this spreadsheet later as I am continuing to add more rounds as I go.
Crits
The most "suspect" number you'll see is in the 25% crit range. On the overall analysis, players are running in <10 percentile for 25% crits and opponents are running around 25%. To be clear, the OBSERVED crit rates are 23.65% for players at 24.21% for opponents. The percentiles expressed above are their binomial likelihood of being observed. This difference is also more pronounced if you isolate the analysis to "Reward Rounds", where players are at 22.29% observed crit rate (9.26% binomial performance) against 26.72% for opponents (80.16% binomial performance).
Roll Percentile
The percentile analysis looks a little "chunky", but the overall averages fall right where I'd expect. So far, I've attributed the chunky-ness to characters with narrower roll windows (which could have a disproportionate number of rolls allocated to different percentiles). I've eliminated rolls with min-max spreads of less than 100, but that didn't solve all of it. However, I am satisfied with the overall distribution.
Expected vs Observed Wins
The expected win analysis is sort of where the rubber meets the road. The Expected Win% is entirely calculated by the iampicard tool. I will admit, I did not research the details on how this number is constructed. Suffice to say, it is independent of anything Disruptor Beam is doing on their side. If there are any biases elsewhere (like players having lower crit rates in certain situations) they would necessarily have to manifest as additional losses on the player side.
Across all rounds, the average expected win rate was 71.73% and the observed rate was 72.54%. In reward rounds, players tended to get a little more conservative and go for more likely wins. The expected rate was 78.83% and observed rate was 79.34%. Given how close all of these values are, I am unable to show any evidence of malfeasance.
20
Comments
One question though - I think you shared a concern about players getting an increase in particular dual skills after being used or needing a revive - were you able to obtain any data on that front?
I am not collecting any data on what I'll call "matchup presentation". That would have to be its own study. My data isn't compatible with that analysis.
I actually expected more pushback when I posted this. There was a post on the STT Reddit about fatigued rolls that I could easily add to my analysis tomorrow.
You know, that might be worth looking at for funsies...
Excellent work collecting all the data, and doing the analysis.
In terms of funsies, I happen to have a 0-0 mirror match. I'd planned on adding a couple of these to my mirror mirror match data for the lolz, but it took me too long to get just this one.
Consider participating in civil discourse, understanding the Tardigrade, and wandering with the Subspace Eddies.
I did see a 6-debuffed gauntlet character once (won a 0 vs 0 slap fest)
The percentile scores are pretty much spot-on with what is expected.
I might be a little worried about the 5/25% crit ratings above if they manifested in the results. However, we are currently outpacing expected win% by 2.4% here. The slightly lower crit ratings don't seem to be manifesting as any sort of lower win%.
EDIT: The 0/1 analysis is going to have to wait until later today. It's going to require a bit of a rework since I have to basically invert all of my conditionals on every single cell of the analysis sheet.
Ok, fine. My paranoia is more valuable than your "data".
Now I'm off to go buy some supplements from my favourite online store. They contain 5% more lead now! Breakfast of champions.
So this is how far my knowledge of stats goes:
the stats compiled here are what i'll call "first order" statistics - just raw counts and percentages. this is a great start and some hard data.
but i remember from college stats class is which stats are statistically significant. for instance, to the naked eye, expected vs observed win% seem close (with the exception of the 1, 10, and 20% brackets). but in reality, i think the 60 and 70% brackets do show some statistical deviation, especially given the sample size. now it doesn't help the players paranoia since the two brackets offset each other, but i think the 70% bracket is what most players experience: they feel like they should win, but they don't. and it makes sense that this would be the 2nd highest match total - players only play matches where they are expecting to win.
also, the roll percentile figures line up with players' paranoia: the defender will consistently roll a 70/80/90%ile roll more frequently than a player will. and mind you, that's with a lower defenders rolls total sample size (presumably b/c players are trying to find matches where they have 2 stats vs a defender's 1 stat). that just means the RNG is skewed to tilt higher for the defender vs the player.
For starters, I 100% invite anyone with a stronger statistical background to take a look at this. I spent a few hours a few weeks ago trying to figure out what sort of tests I should apply to this analysis and I found myself very quickly out of my league in terms of numerical analysis.
In terms of win% per decile, I don't really know a good test for significance. Applying the Binomial distribution is incorrect because each match has a unique win probability. It's not like Crit% where every roll should have the same probability of critting. Even if I DO apply the Binomial distribution here, the %s are no worse than what we see with the 25% crit range:
There are also, at most, 139 matches for any decile other than the 90-99 range. Collectively, 1087 is a decently large sample size. 102 matches in the 70-79s and 69 in 60-69 is still very tiny. If these relationships continue to be skewed like this as the data set grows, I agree, this could rise to a point of concern, but it isn't there yet.
Can you please clarify what you mean here? I have observed 30.05% of player rolls at 70%+ vs. 30.31% of opponent rolls. A quarter percent difference is not much of a difference.
You will see more Player rolls because players will tend to target opponents who have weaker rolls and that usually means going after an opponent with only one of the two chosen stats. However, the percentiles are all still calculated the same way. If the RNG was skewed to "tilt higher" in 2-stat-vs-1-stat matchups, you would see it manifest in a higher proportion of the rolls being in the higher percentile range. This just isn't happening.
btw, just to clarify, this wasn't a criticism of your statistical analysis. i'm more than glad that you've been able to put this together
for the 2nd part, i was talking about 70%ile: 10.71 vs 10.08, 80%ile roll: 9.41 vs 10.21, 90%ile roll: 9.85 vs 10.05. yes, the 70% roll is a player advantage, but the 80%ile and 90%ile rolls definitely benefit the defender. this supports the players' paranoia of always rolling low and defender always rolling high. so not to nitpick, but that's 29.97% of player rolls being 70+%, and 30.34% defenders. but the real issue is player 80+ being only 19.26% vs defender 20.26%.
put another way:
roll "buckets" that have a player advantage:
0, 10, 30, 60, 70
roll buckets that have a defender advantage:
20, 40, 50, 80, 90
yes, that's an even 5 vs 5 split, but the defender has more of the higher buckets, and an overall higher roll.
yes, these might be small numbers, but again, this is more about observing patterns. and it doesn't help the player paranoia that it's only a "9" for players and a "10" for defender in the 80/90 buckets
and the most damning piece of evidence: the highest single bucket on either side is player's 0-10% roll at 10.96% of rolls (more than a half percent higher than the defender roll).
First, the quantity in each "bucket". Yes, the "opponent" has, currently, a 0.45% in quantity of rolls, but the player average 0.15% higher rolls for the ones that landed in that range. One of the other problems is that the Player rolls are a LOT more susceptible to "clumping" due to character choice. Two players (myself and Joker) probably account for ~70% of the total rounds in here (complete guess, BTW, I didn't keep track of the source of any rounds). That means the charters that the two of us use have a significant impact on the results displayed.
I'll use Mirror Picard's science roll as an example:
Min roll: 21
Max roll 88
21 to 27 will be between 0 and 10% (7 possible rolls)
28 to 34 will be between 10 and 20% (7 possible rolls)
35 to 41 will be between 20 and 30% (7 possible rolls)
42 to 47 will be between 30 and 40% (6 possible rolls)
48 to 54 will be between 40 and 50% (7 possible rolls)
55 to 61 will be between 50 and 60% (7 possible rolls)
62 to 67 will be between 60 and 70% (6 possible rolls)
68 to 74 will be between 70 and 80% (7 possible rolls)
75 to 81 will be between 80 and 90% (7 possible rolls)
82 to 88 will be between 90 and 100% (7 possible rolls)
The deciles with 7 possible rolls have a 10.3% chance of being rolled
The deciles with 6 possible rolls have a 8.8% chance of being rolled
So, a "perfectly normal" roll for a large data set of JUST Mirror Picard science rolls would have ~10% of all deciles except for 30-40 and 60-70 which should be below 9%.
I've tried to mitigate the worst of this effect by not considering any rolls with a "spread" (max - min) of less than 100, but it still is going to play a roll.
EDIT: So, to sum all of this up, I feel it's important to keep in mind that, at the end of all the examination on a roll-level, if any perceived imbalances aren't reflected in actual changes in expected Wins/Losses, does it actually matter? In my opinion, no, it doesn't.
but the defenders are technically other players' gauntlet lineups. hence the walls of Mirror Picards/Mirror Phloxes, etc.
So i think that would mitigate against your concern about player clumping - since it should be similarly clumped on both sides.
one thing that may be missing and thus skewing your data: non-ideal selections of crew (whether by players' choice, or the fact that they have not FEed their crew yet). that would give a small percentage of rolls that are outside the normal set of clumping. i guess without knowing how many players don't have a maxed roll, it'd be hard to "discount" the effects of those rolls.
Unless I get a lot of OTHER contributors, opponent rolls are always going to be more evenly distributed than player rolls. For me, I have about 7 or 8 different crew that I realistically use in the gauntlet, so that's around a third of the data is going to be based on those 7 or 8 crew members. Compare that to my opponents which will have tons of different crew even within the same gauntlet.
Yes, there is a certain "race to the bottom" where everyone is eventually using the same strongest crew, but I'm also almost always going to pick the most favorable matchups for myself, which usually means picking the weakest opponent which is, more often than not, going to NOT be one of the "ideal" crew.
Do you want to continue collecting data, or do you consider the questions acceptably answered?
I plan on continuing for now. Originally, I wanted 10k rounds. It seemed like a nice round number.
The biggest missing piece is mirror match analysis, but without intentionally gimping my gauntlets, it will be tough to get a large number of mirror rounds.
My gauntlet rares so far have been a single Caretaker, five Guinans, and two Locuti.
I got 2 Locutus, 1 Guinan, and 0 Caretakers (to date; my Guinan came in the last month she was available)